TL;DR: An Amazon sales estimator helps you determine whether a product has enough demand to justify further research. A profitability calculator shows whether that demand can produce acceptable profit after product costs, Amazon fees, fulfillment, shipping, advertising, storage, and returns. For most product searches, use demand to screen ideas first, validate margin immediately afterward, and then revisit both as your assumptions become more accurate.
Key Takeaways
- A sales estimator models demand from BSR, category, ASIN, price, and historical marketplace signals. It does not reveal a competitor's confirmed Amazon order data.
- A profitability calculator evaluates unit economics using selling price, product cost, Amazon fees, fulfillment, inbound shipping, PPC, promotions, returns, storage, and other expenses.
- The most practical workflow is demand first for initial screening, margin immediately after, and repeated scenario testing before sourcing or scaling.
Table of Contents
Marketplace note: This guide focuses on the Amazon US marketplace. Sales estimates, fee structures, size tiers, currencies, and profitability assumptions differ across marketplaces.
Quick Answer
Start with demand when you are screening a broad list of product ideas, but do not treat demand as a pass until you have tested margin. The best sequence is Sales Estimator first for fast opportunity filtering, Profitability Calculator second for financial validation, and then repeated testing of both demand and cost assumptions.
A product with attractive estimated sales may still be unviable because of a high referral fee, expensive FBA fulfillment, dimensional weight, advertising dependence, returns, or a price ceiling that leaves too little margin. At the same time, a product showing excellent profit per unit may not justify sourcing if realistic monthly demand is too low or concentrated among a small number of dominant brands.
SellerSprite provides both tools required for this first-pass workflow. The free SellerSprite Sales Estimator converts BSR or ASIN data into estimated sales and trend insights. The SellerSprite Profitability Calculator then lets you test whether your expected selling price and cost structure produce sufficient net profit, profit margin, and ROI.
The practical answer: Demand first for screening, margin immediately afterward, and neither in isolation. Sales estimates and profit calculations are both models, so the final decision should be based on ranges rather than one optimistic number.
For a broader overview of the different calculators used across product research, pricing, shipping, PPC, and break-even planning, see our Amazon calculator guide.
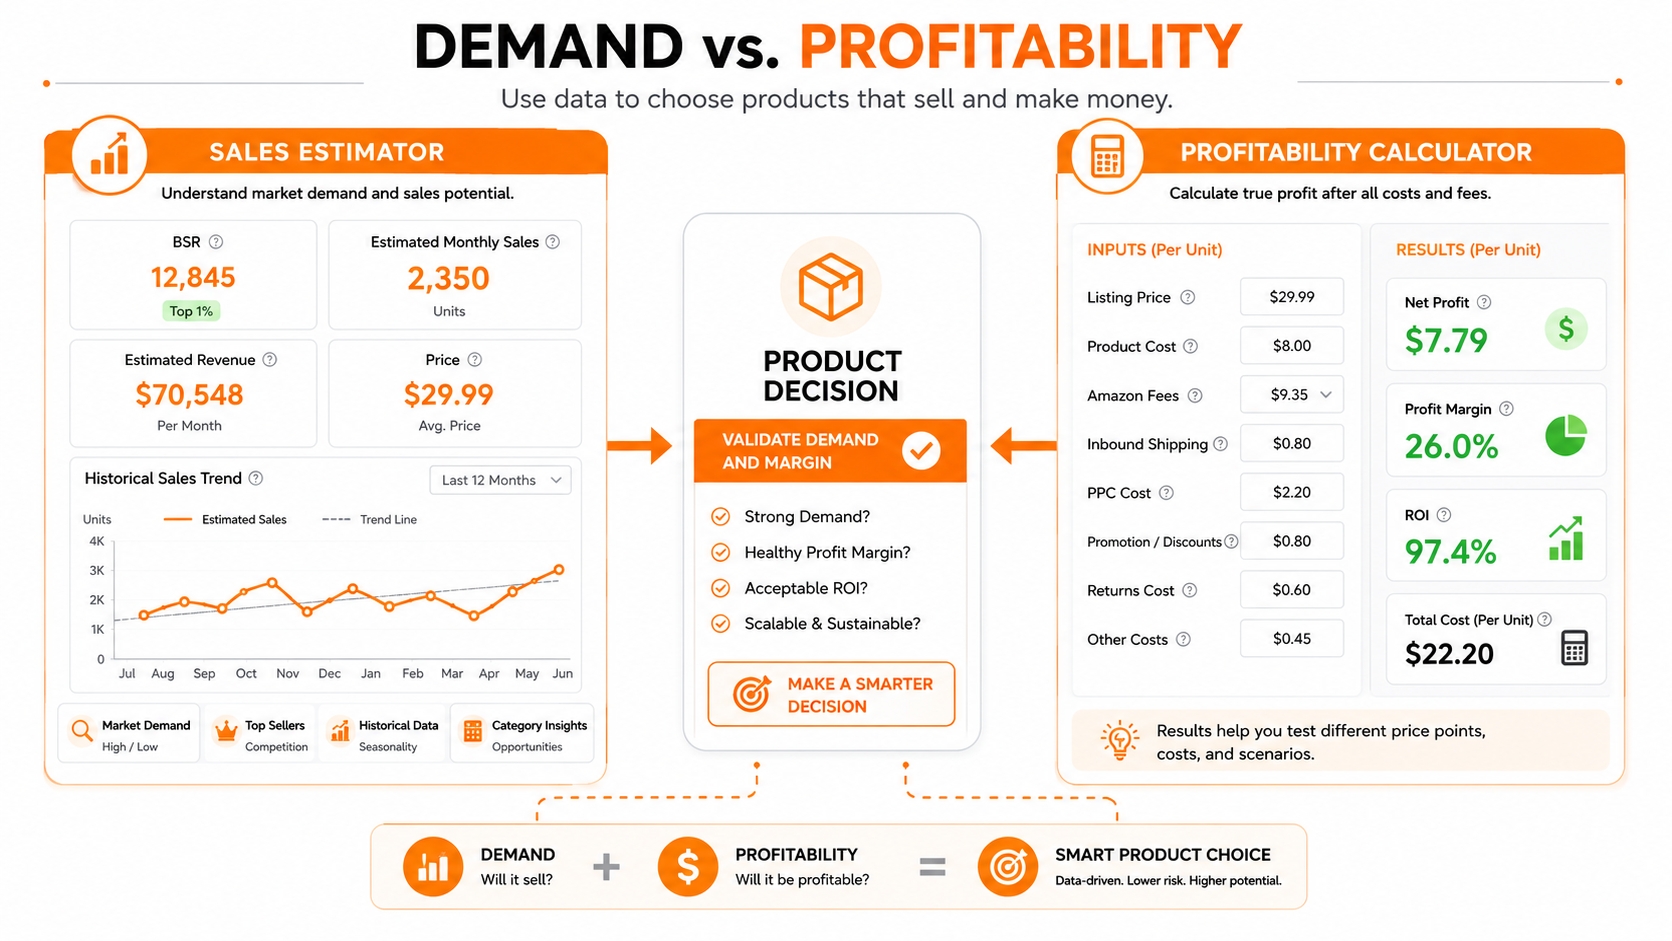
Demand and profitability answer different questions
| Tool | Primary Question | Main Output | What It Cannot Confirm |
|---|---|---|---|
| Sales Estimator | Is there enough observable demand to justify deeper research? | Estimated daily or monthly sales, revenue, and historical performance trends | Your future market share or a competitor's confirmed order volume |
| Profitability Calculator | Can the product generate acceptable profit under realistic assumptions? | Net profit, profit margin, ROI, revenue summary, and cost breakdown | Whether buyers will purchase the product at the modeled price and volume |
What a Sales Estimator Answers
An Amazon sales estimator converts marketplace signals into an approximate sales range. It is useful because Amazon does not disclose a competitor's confirmed order data to other sellers. The estimate should therefore be treated as a directional model rather than a replacement for Amazon's internal sales reports.
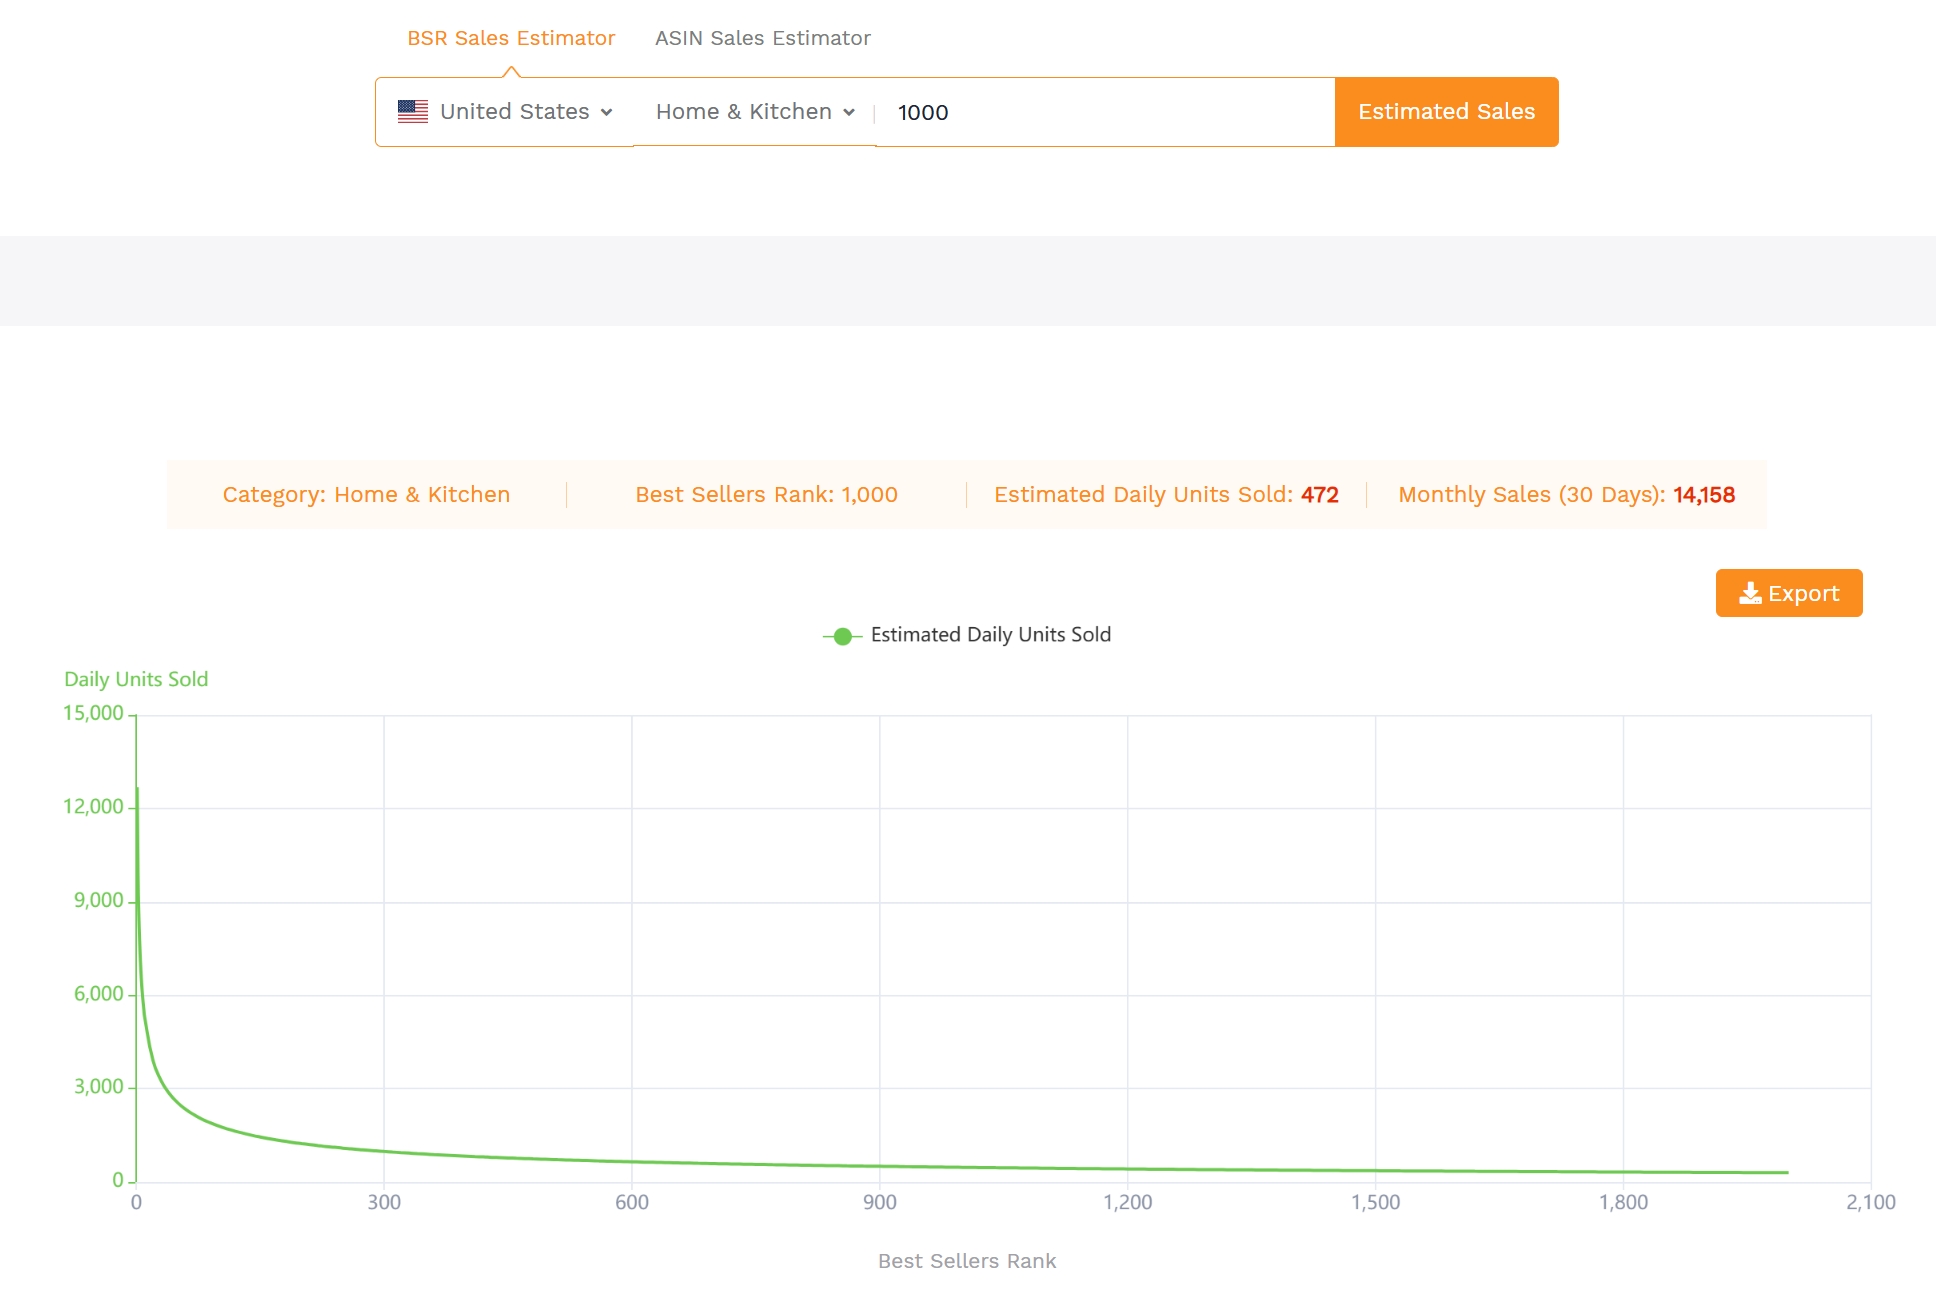
Estimated sales at a given BSR
SellerSprite's BSR Sales Estimator allows you to select an Amazon marketplace and product category, then enter a Best Sellers Rank. The result provides estimated daily and monthly unit sales for that rank and a visual curve showing how estimated sales change across different BSR positions in the selected category.
Category selection is essential. A BSR of 2,000 in a high-volume category may represent a very different sales level from the same rank in a smaller category. Never compare BSR values across unrelated categories without recalculating the estimate.
ASIN-level sales and revenue trends
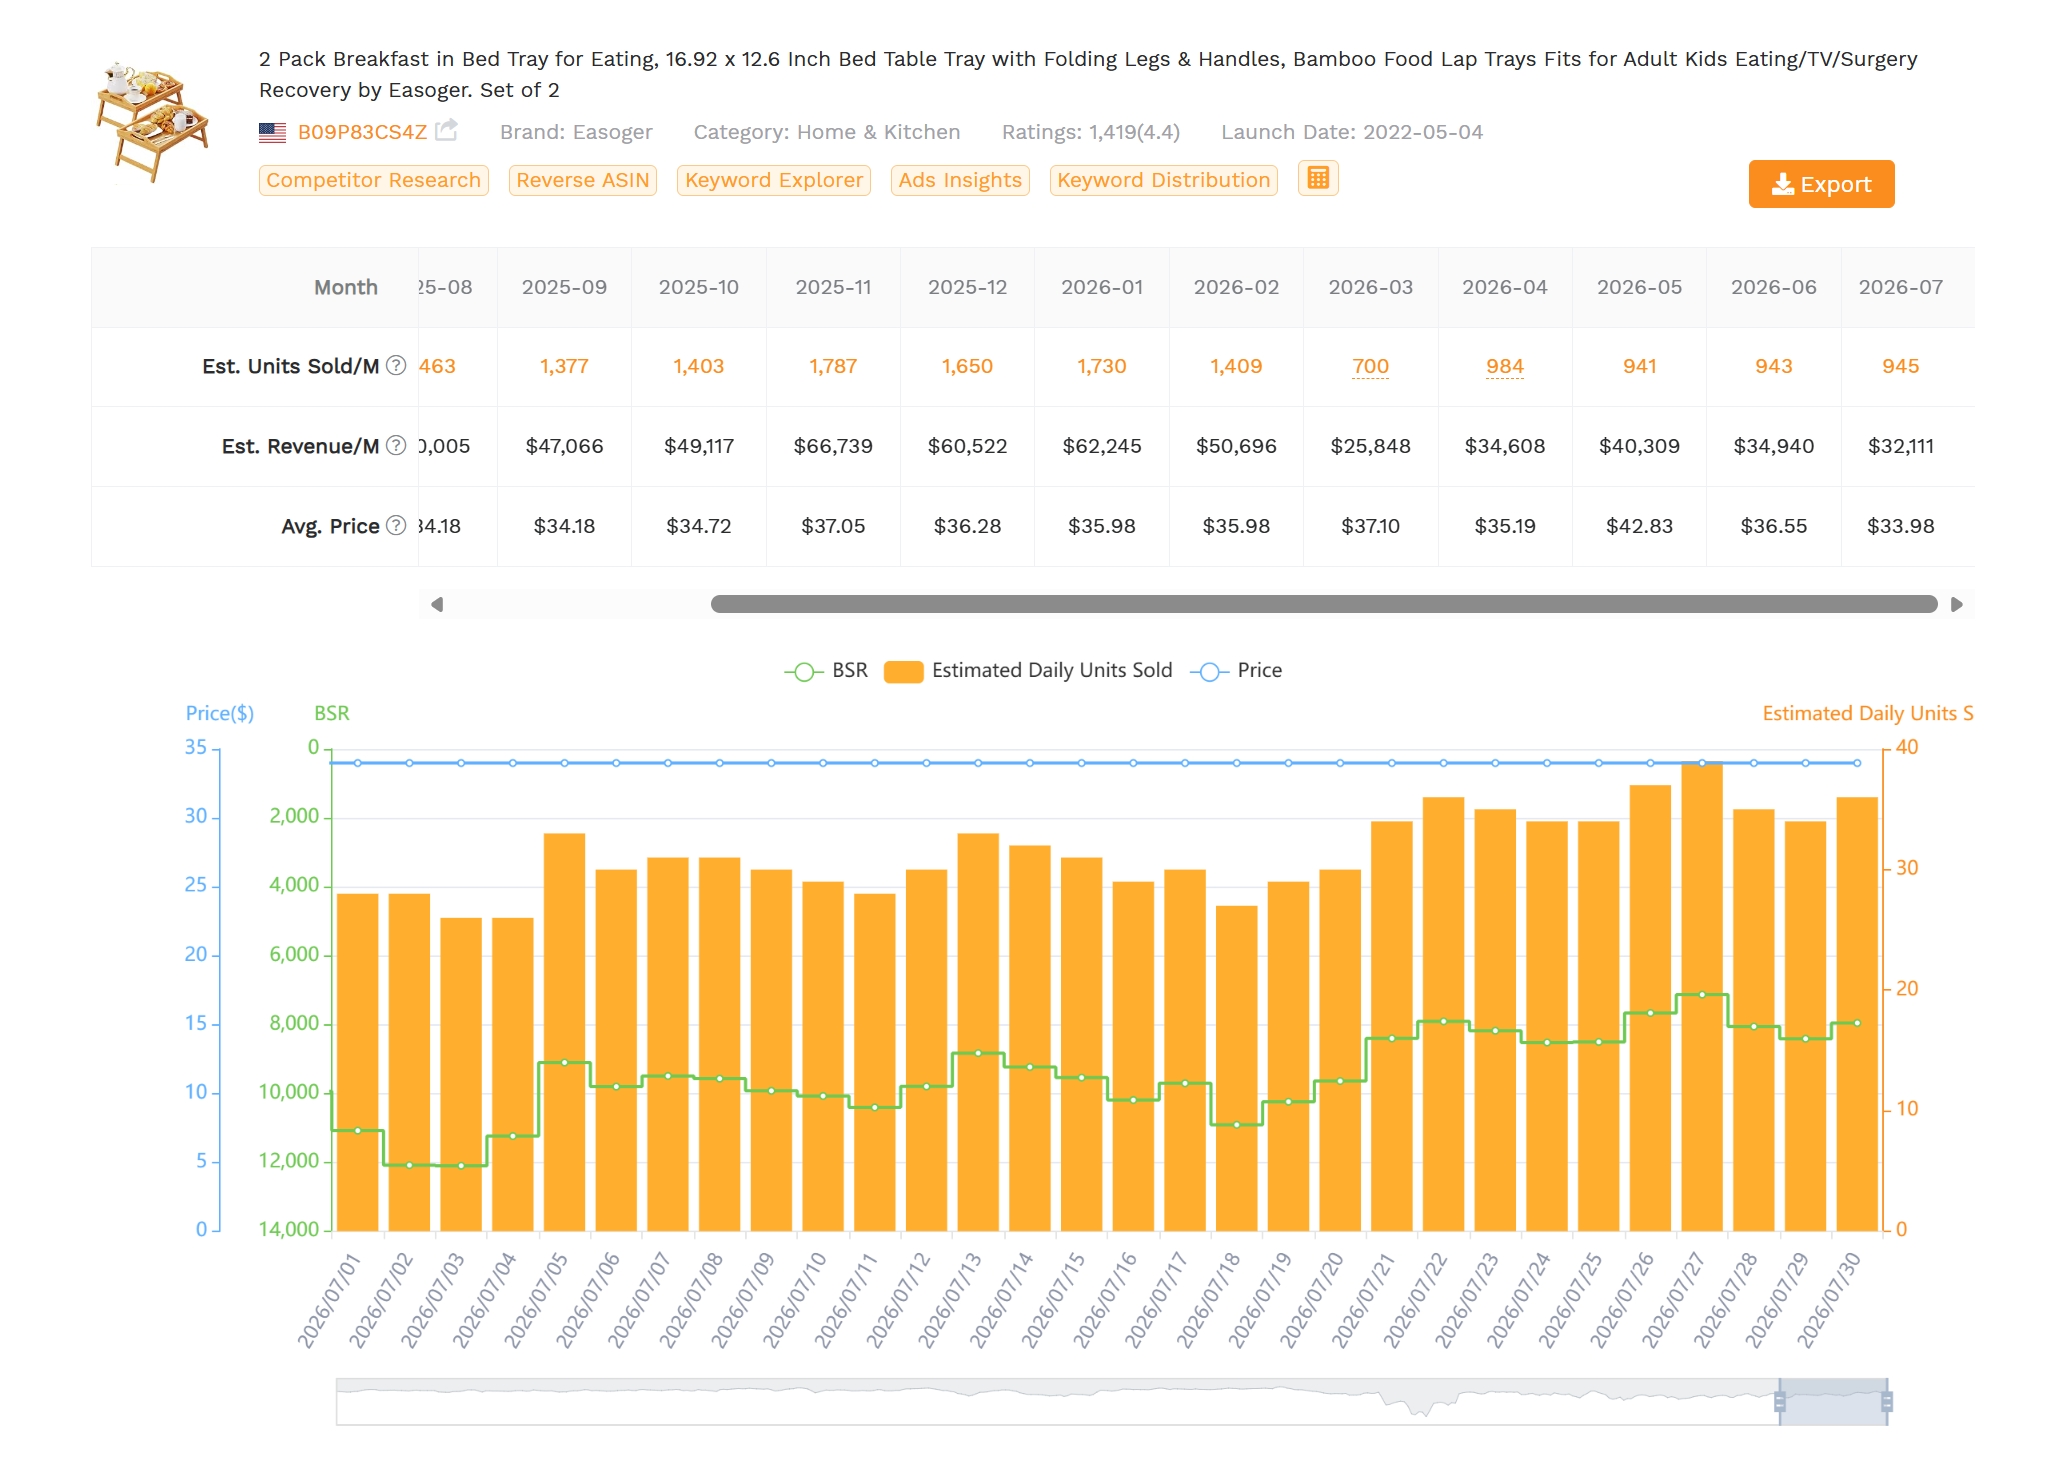
SellerSprite's ASIN Sales Estimator lets you enter a product ASIN to review modeled monthly sales, estimated revenue, listing price, and historical performance. The historical chart can help reveal whether estimated demand is stable, growing, declining, seasonal, or affected by sharp short-term changes.
This is more useful than relying on one current BSR. A single snapshot may reflect a promotion, stock recovery, price change, seasonal event, or temporary advertising push. Historical patterns provide context for deciding whether the current estimate is representative.
Demand distribution across competitors
One successful ASIN does not prove that a market is broadly accessible. Query a representative competitor set rather than using only the category leader. Include:
- Several top-ranked listings
- Mid-ranked listings with similar features and prices
- Newer listings with fewer reviews
- Products from both dominant and independent brands
- Listings at the price point you could realistically support
Record each estimate in a worksheet and calculate a range for the competitor set. This provides a more useful bottom-up view of opportunity than assuming that the category leader's volume is available to every new entrant.
Seasonality and volatility
Historical trends can reveal whether demand is concentrated around a narrow seasonal window. A product that performs strongly for two months may still be attractive, but inventory planning, launch timing, and storage assumptions must reflect the shorter selling period.
Volatile sales estimates should also receive a wider confidence range. A stable product might support a relatively narrow downside and upside model, while a heavily promoted or seasonal product requires more conservative inventory assumptions.
Estimation rule: Do not convert one estimated monthly sales figure directly into a purchase order. First compare multiple ASINs, review historical patterns, check keyword demand, and model a downside case.
What a sales estimator cannot answer
A sales estimator cannot confirm:
- The competitor's actual Amazon order count
- The sales volume your new listing will automatically capture
- The conversion rate of your future listing
- The amount of PPC required to reach the estimated volume
- Whether the market price can support your cost structure
- Whether a sales spike came from sustainable organic demand
Use the estimate as the demand side of a product hypothesis. The financial side still needs to be tested separately.
What a Profitability Calculator Answers
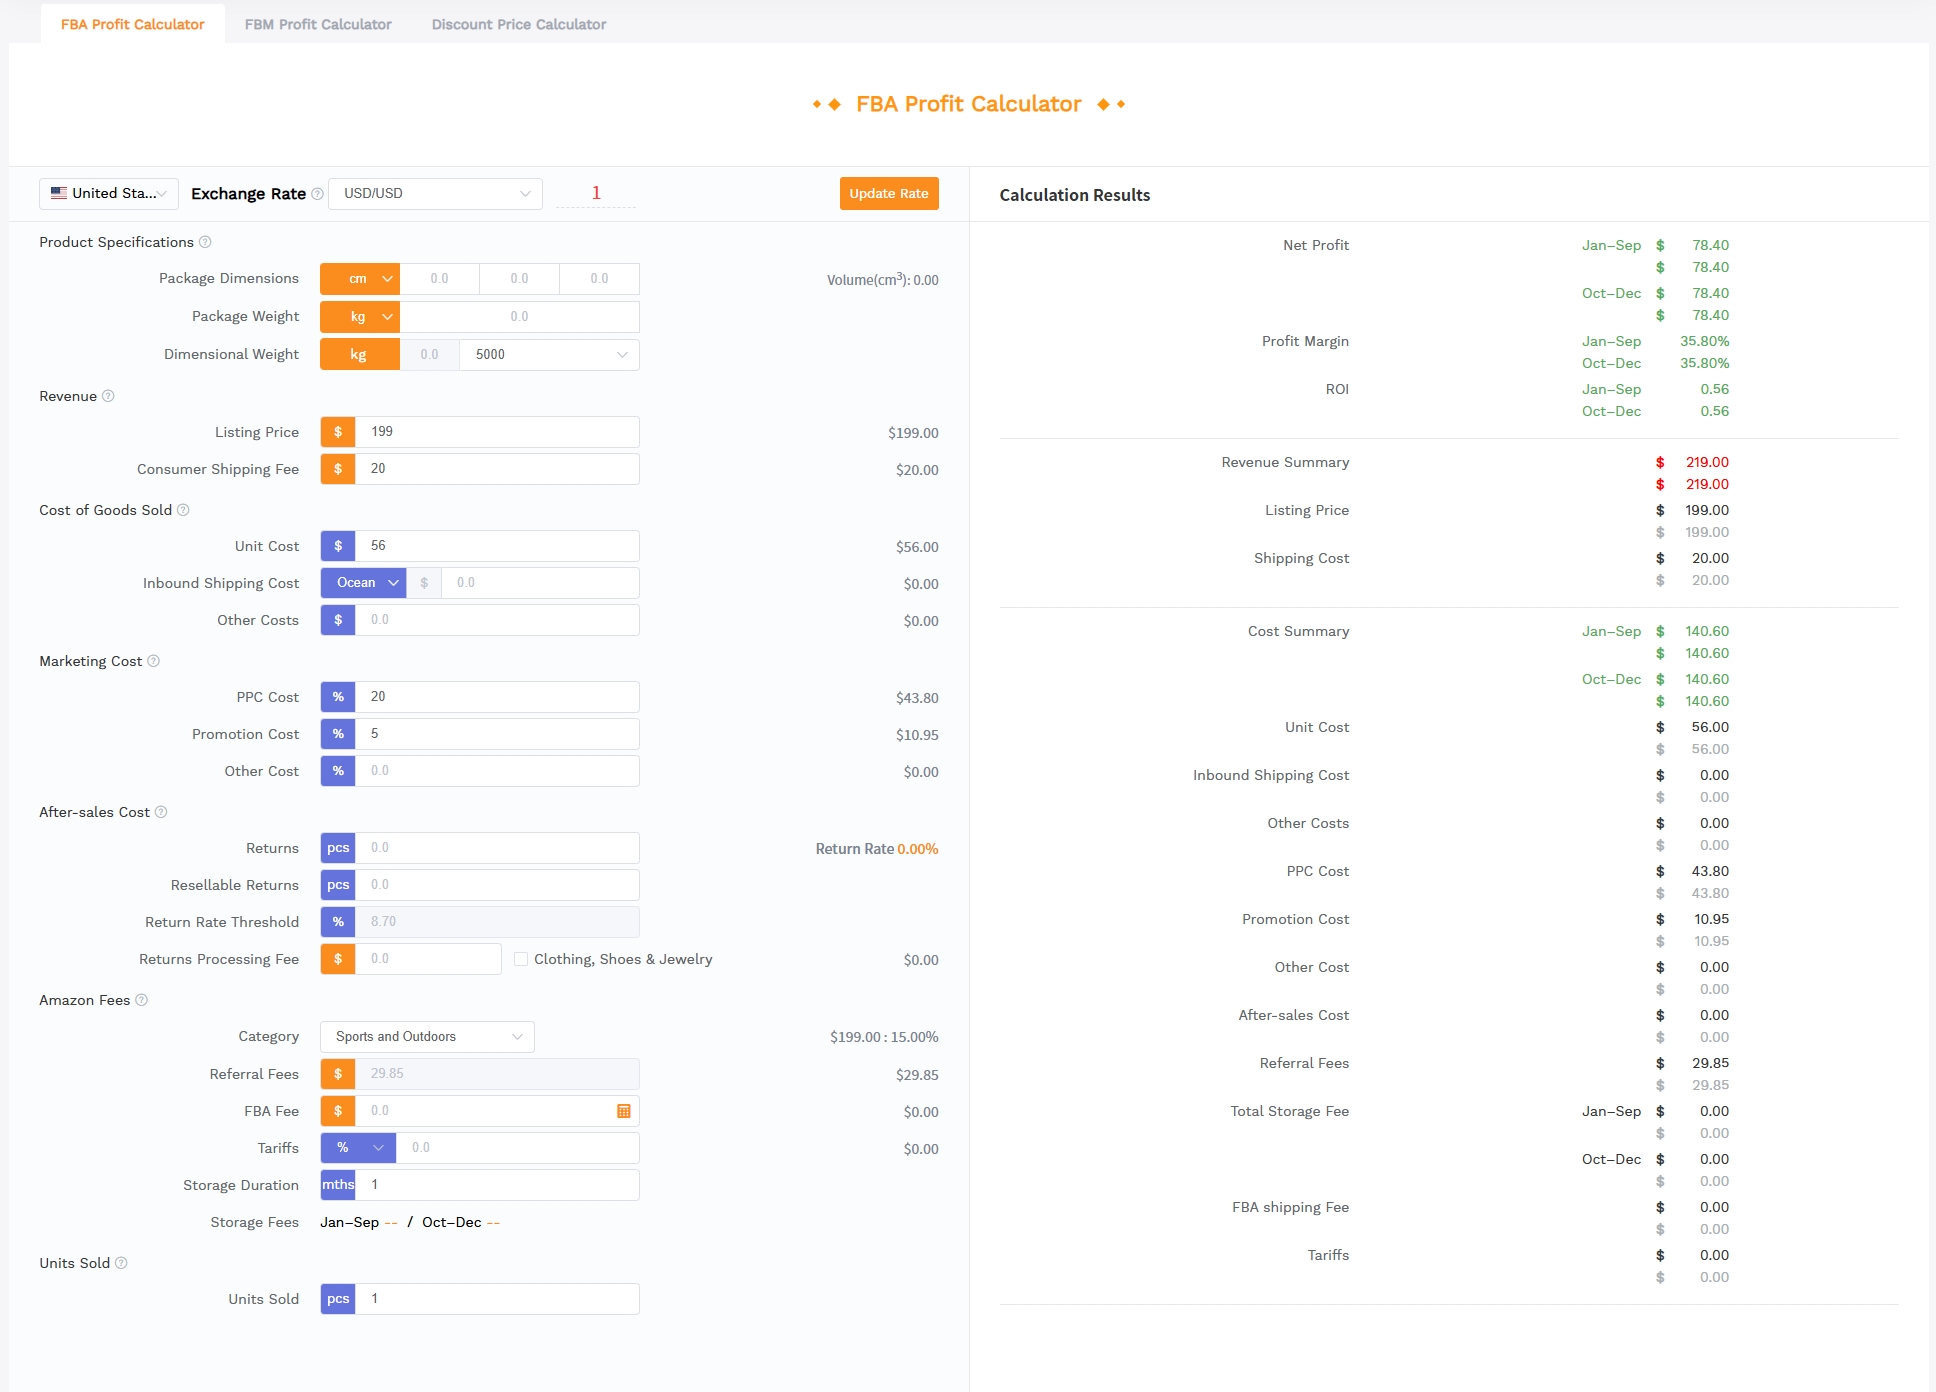
Demand becomes commercially meaningful only when the selling price can cover every relevant cost and leave enough return for the risk involved. The SellerSprite Profitability Calculator supports both FBA and FBM scenarios and helps sellers build a more complete unit-economics model before sourcing or scaling.
Net profit per unit
Net profit is the estimated amount remaining from one sale after the entered costs have been deducted. Depending on the scenario, relevant inputs may include:
- Listing price and consumer shipping fee
- Unit cost
- Inbound shipping
- Other sourcing and operational costs
- PPC and promotion costs
- Returns and after-sales costs
- Referral fee
- FBA fulfillment fee or FBM fulfillment expenses
- Tariffs
- Storage duration and estimated storage fee
The result is still an estimate. Its usefulness depends on the accuracy of your dimensions, weight, cost, fee, return, and advertising assumptions.
Profit margin
Profit margin shows how much of the sale remains as estimated profit after the modeled costs. It helps compare products with different selling prices.
There is no universal pass mark for every Amazon product. A lower-margin replenishable product with stable demand and fast inventory turnover may be acceptable to one seller, while another seller may require a larger margin because of high return risk, compliance requirements, seasonal exposure, or volatile PPC costs.
Return on investment
ROI helps compare estimated profit with the capital committed to each unit. It is especially useful when two products have similar profit margins but require very different unit costs.
The calculator's ROI output should be evaluated together with expected inventory turnover. A strong per-unit ROI does not guarantee an attractive annual business result if inventory takes a long time to sell.
Amazon fee and fulfillment impact
Product category, dimensions, packaged weight, dimensional weight, and fulfillment method can materially change the result. The calculator lets you select a marketplace and category, enter product specifications, and estimate applicable referral and FBA-related costs.
Fees and classifications can change, so verify critical assumptions against the current Seller Central fee pages or Amazon's Revenue Calculator before committing to a large order.
Advertising and return sensitivity
A product may look profitable before PPC but become unattractive once advertising and returns are included. Instead of entering one optimistic percentage, calculate several cases:
- Efficient case: Lower PPC and return costs
- Expected case: Realistic category assumptions
- Downside case: Higher PPC, promotions, and returns
A product is more resilient when it remains acceptable in the downside case rather than passing only under ideal assumptions.
Total profit at an estimated sales level
Estimated monthly sales are not required to calculate per-unit profit. However, once a per-unit result is available, you can use the Units Sold input or multiply the result by a conservative sales range to estimate total monthly profit.
Estimated Monthly Profit = Estimated Monthly Units x Estimated Net Profit per Unit
Illustrative profitability scenario
| Input | Assumption |
|---|---|
| Selling price | $29.99 |
| Unit cost | $8.50 |
| Inbound shipping | $1.50 |
| Referral fee | $4.50 |
| FBA fulfillment fee | $4.20 |
| PPC cost | $4.50 |
| Returns and other costs | $1.00 |
| Estimated net profit | $5.79 per unit |
| Estimated profit margin | 19.3% |
Illustrative example only: These values are not a current fee quote for a specific ASIN. Actual referral fees, fulfillment fees, storage, returns, and PPC costs depend on the product and marketplace.
Which Tool Should You Use First?
There is no need to choose one tool and ignore the other. The real question is which uncertainty should be removed first at each research stage.
Use demand first when screening many ideas
When starting with a long list of product ideas, demand estimation is usually the faster first filter. There is little value in building a detailed cost model for every idea if the observable market is too small, highly seasonal, or concentrated around products you cannot realistically match.
Use the Sales Estimator to identify products that deserve deeper research. Do not apply one universal minimum monthly-sales threshold. Define the required demand based on expected selling price, target profit per unit, capital available, and business scale.
Run a quick margin gate before deep research
Once an idea shows credible demand, run a rough profitability calculation before investing time in detailed keyword, review, patent, supplier, and launch analysis.
At this stage, the cost inputs may still be estimates. Use conservative ranges for unit cost, shipping, PPC, and returns. The purpose is not to produce a final profit forecast. It is to identify obvious economic problems early.
Return to demand after supplier quotes arrive
A supplier quote may change the product specification, package dimensions, MOQ, price, or bundle configuration. Those changes can affect both profitability and market demand.
For example, a more compact package may reduce FBA fees, while a higher selling price required to protect margin may reduce conversion. Revisit competitor prices and estimated sales after the cost model changes.
Use margin first when the cost risk is obvious
A quick profitability check can come first when the product has a clear cost risk, such as:
- Large or heavy packaging
- Low market selling price
- Expensive or volatile materials
- High expected return rates
- Category-specific referral fees
- Compliance, testing, or certification costs
- Long international shipping routes
If the product cannot pass even a rough economic screen, detailed demand analysis may not be necessary unless the product can be redesigned or repositioned.
Recommended research sequence
- Screen demand using representative BSRs or ASINs.
- Run a rough profitability model using conservative costs.
- Validate market depth, keywords, competition, reviews, and seasonality.
- Request supplier, freight, packaging, and compliance quotes.
- Update the profitability model with stronger inputs.
- Recheck demand at the required selling price and product configuration.
- Test downside, expected, and upside cases before ordering inventory.
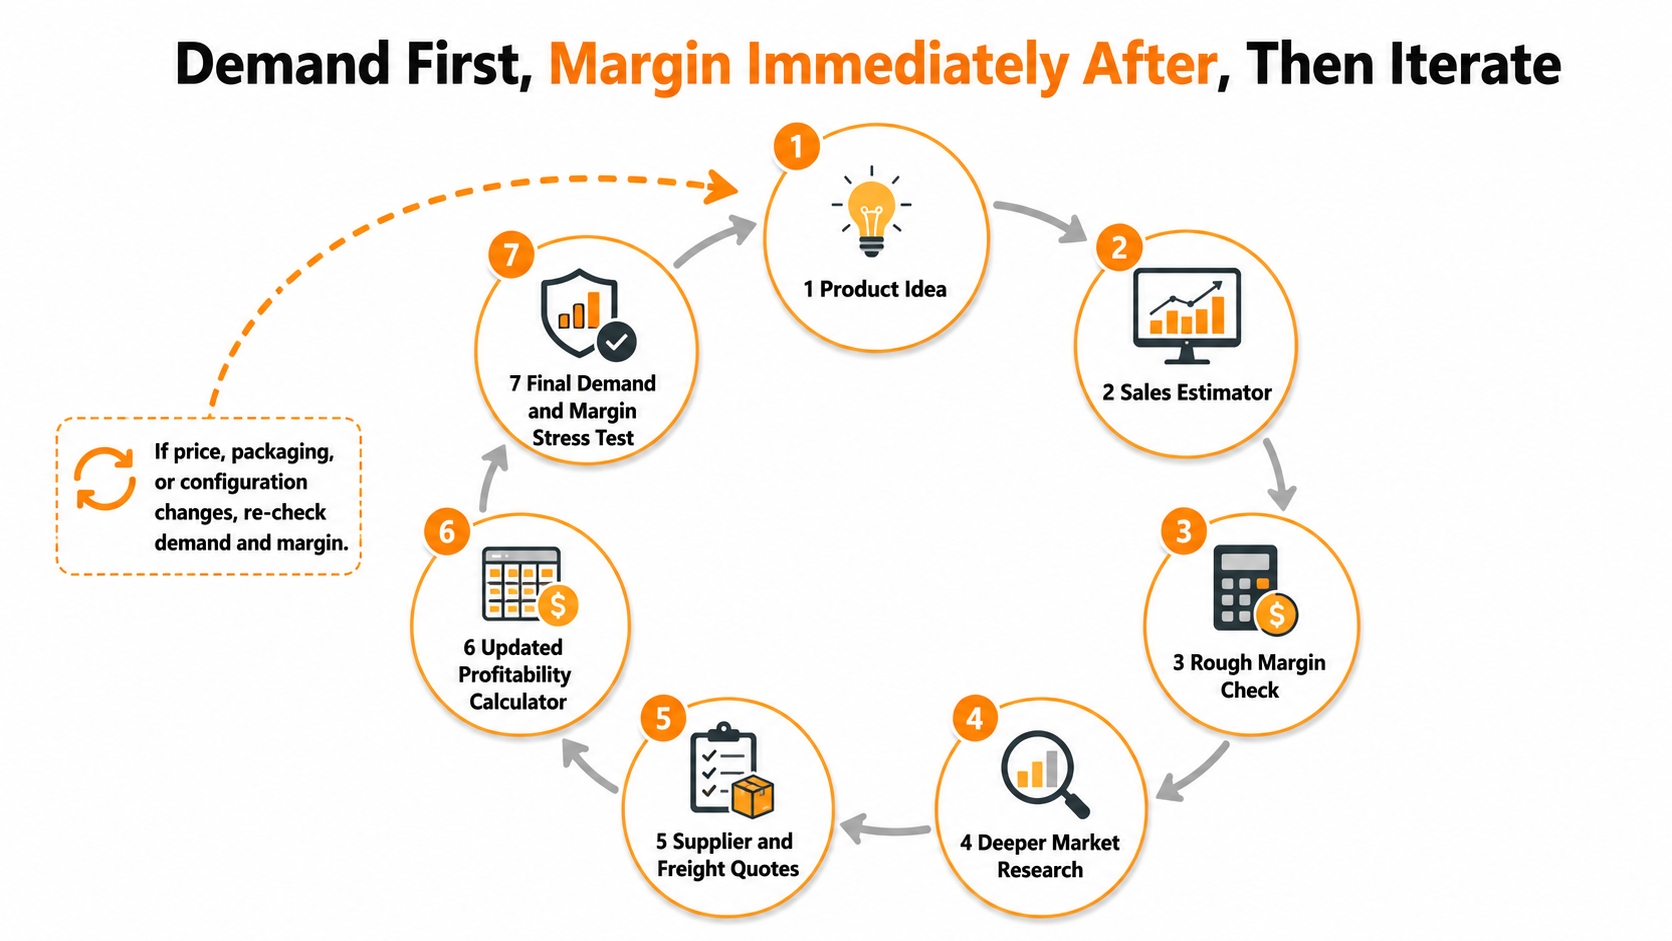
SellerSprite Demand-to-Margin Workflow
The following workflow uses SellerSprite's two free tools as separate but connected research stages. Results are transferred manually so that each assumption can be reviewed rather than accepted automatically.
Step 1: Build a representative competitor set
Select several products that closely match your proposed use case, price range, material, size, target customer, and feature set. Avoid using only the category leader or unrelated products that happen to rank for the same broad keyword.
Step 2: Estimate sales by category and BSR
Open the SellerSprite Sales Estimator. Start with BSR Sales Estimator, select the correct marketplace and main category, and enter several representative BSR levels.
Record the estimated daily and monthly sales associated with each level. This provides a rough map of how much sales velocity different rank positions may represent in that category.
Step 3: Review individual ASIN trends
Switch to ASIN Sales Estimator and research the selected competitors one at a time. Record estimated monthly units, revenue, price, BSR movement, and historical sales patterns.
Look for consistency rather than the highest single estimate. A market with several stable sellers may be more accessible than one where nearly all visible demand appears concentrated in one established listing.
Step 4: Define a demand range
Convert the competitor findings into three demand cases for your research model:
- Downside case: A cautious share of the lower competitor range
- Expected case: A realistic result if the product and listing perform adequately
- Upside case: A stronger outcome that should not be used as the purchasing baseline
Do not assume that a new listing will immediately match established competitors. Account for launch time, reviews, conversion, PPC, inventory availability, and brand trust.
Step 5: Build the per-unit cost model
Open the SellerSprite Profitability Calculator. Select FBA or FBM, choose the marketplace, and enter the best available assumptions for:
- Packaged dimensions and weight
- Listing price
- Unit cost
- Inbound shipping
- Other sourcing costs
- PPC and promotion costs
- Returns and after-sales costs
- Category and Amazon fees
- Tariffs and storage duration
Step 6: Stress-test price and costs
Do not stop after the first profitable result. Test at least:
- A lower competitive selling price
- A higher unit cost or freight quote
- A higher PPC percentage
- A higher return assumption
- Longer storage duration
- A launch promotion or coupon
Save or label each calculation so you can compare the expected and downside results instead of overwriting the original assumptions.
Step 7: Combine demand and per-unit profit
Apply the per-unit net profit to the demand range produced in the earlier stage.
| Demand Scenario | Estimated Monthly Units | Estimated Net Profit per Unit | Estimated Monthly Profit |
|---|---|---|---|
| Downside | 300 | $5.79 | $1,737.00 |
| Expected | 450 | $5.79 | $2,605.50 |
| Upside | 600 | $5.79 | $3,474.00 |
Illustrative example only: The sales volumes and profitability assumptions above are used only to demonstrate how the two tools can be combined. They are not forecasts for a specific ASIN or product category.
Step 8: Apply your own decision criteria
Before researching products, define the minimum result your business requires. Criteria may include:
- Minimum monthly profit under the downside case
- Minimum profit margin after realistic PPC
- Minimum ROI based on your capital strategy
- Maximum acceptable launch loss
- Maximum inventory clearance period
- Maximum capital committed to the first order
A product should not pass only because one metric looks attractive. The demand range, margin resilience, capital requirement, competitive environment, and operational risk should make sense together.
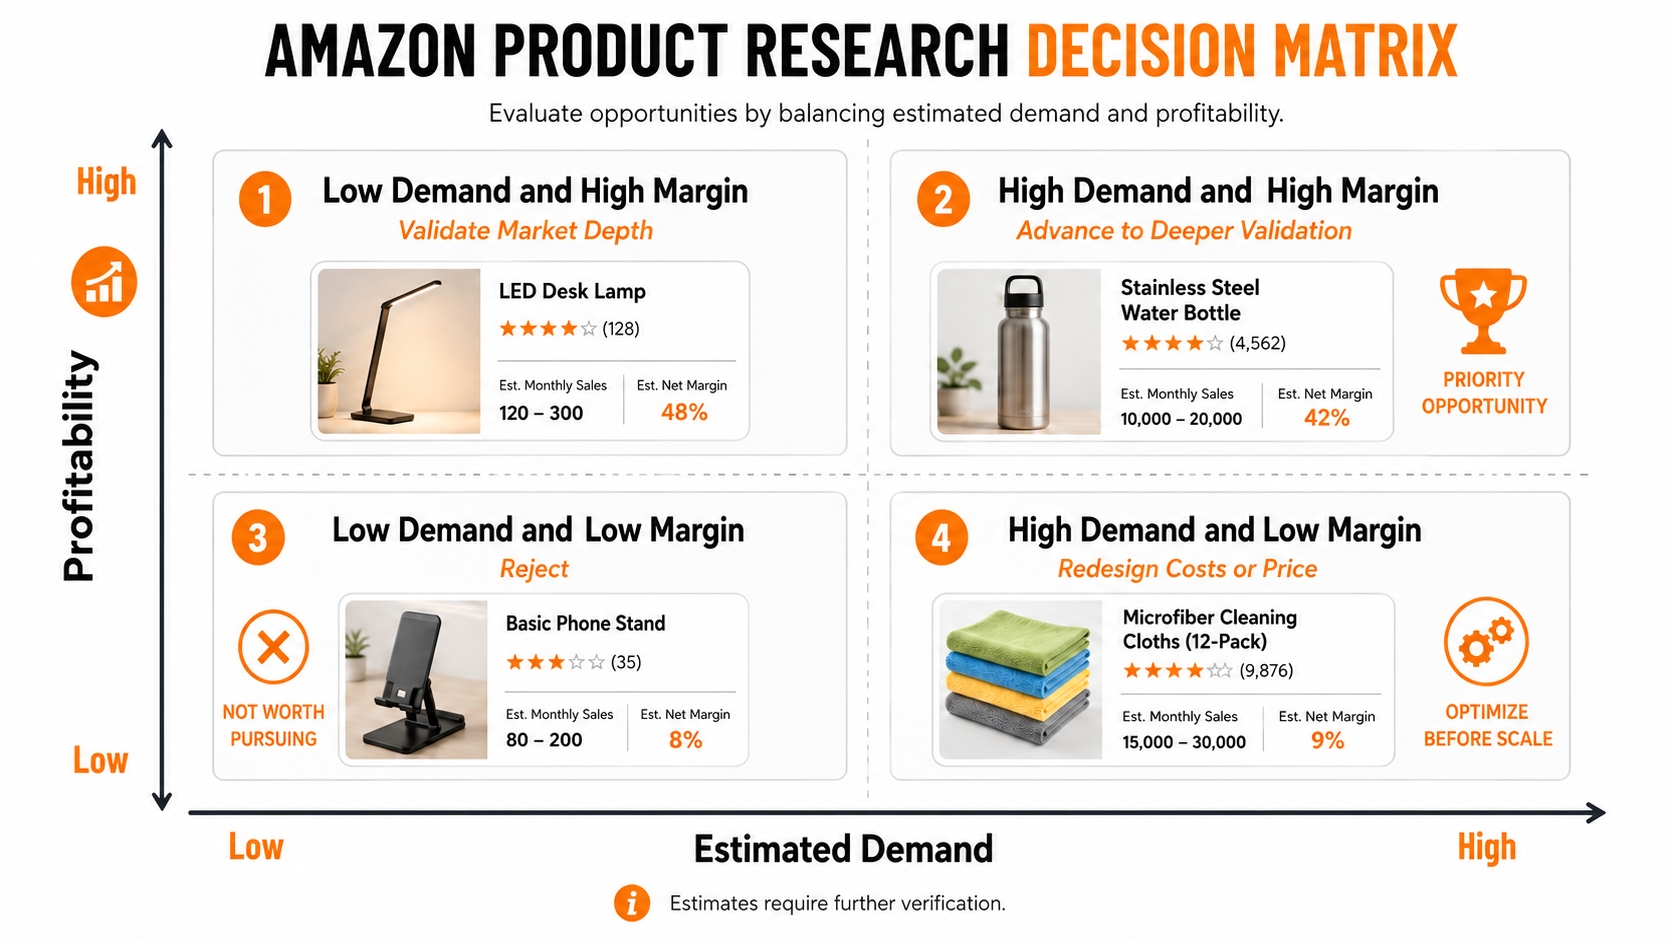
Common Mistakes
Here are some mistakes usually ignored by part of sellers, which you'd better watch out.
Treating estimated sales as guaranteed sales
Competitor estimates describe an existing listing under its current price, reviews, content, advertising, ranking, inventory, and brand conditions. A new listing will not automatically reproduce that result.
Using the category leader as the only benchmark
The highest-selling product may be an outlier. Build a benchmark set that reflects the level of brand strength, price, differentiation, and review count you could realistically reach.
Entering supplier price instead of landed cost
Unit cost should not exclude packaging, inspection, freight, duties, prep, labeling, samples, testing, and other costs required to make the product sale-ready.
Ignoring PPC and returns
A product that passes only before advertising and returns may not be commercially resilient. Include realistic assumptions and test higher-cost cases.
Assuming competitor margins are known
You can model what a competitor's economics might look like under plausible assumptions, but you cannot know its actual factory price, freight rate, ad cost, return rate, or fee agreements.
Using one fixed pass threshold for every category
A low-priced consumable, premium appliance accessory, replacement part, and seasonal gift product require different sales, margin, ROI, and inventory standards.
Testing only the best case
A product that succeeds only at the highest selling price, lowest supplier quote, lowest PPC, and highest estimated demand is not yet a robust opportunity.
Final Go/No-Go Check
- Demand is visible across more than one representative listing.
- Historical performance is consistent with the product's seasonal pattern.
- The required selling price is realistic for the market.
- The downside cost scenario still meets your minimum criteria.
- The first order can sell through within an acceptable period.
- The decision does not depend on one unverified assumption.
FAQ
What is the difference between an Amazon Sales Estimator and a Profitability Calculator?
A Sales Estimator models probable unit sales and revenue from BSR, ASIN, category, price, and historical marketplace signals. A Profitability Calculator uses your product and cost assumptions to estimate net profit, profit margin, ROI, and a detailed cost breakdown. One measures demand potential, while the other measures financial viability.
Should I use the Sales Estimator or Profitability Calculator first?
Use the Sales Estimator first when screening many product ideas, then run a quick profitability check on the strongest candidates. If a product has an obvious cost risk, such as large dimensions or a low market price, a rough profitability calculation can be used as the first elimination step.
Does SellerSprite automatically transfer Sales Estimator data into the Profitability Calculator?
No. The tools support consecutive stages of the same product-research workflow, but sellers should manually carry over and validate relevant assumptions such as selling price and estimated unit volume.
Can high estimated sales still produce low profit?
Yes. High sales volume can still produce weak or negative profit when product cost, FBA fees, inbound shipping, PPC, promotions, storage, and returns consume most of the selling price. Always evaluate per-unit profit and total expected profit together.
Can a high-margin product still be a poor opportunity?
Yes. Strong per-unit profit may not be enough if demand is too low, highly seasonal, concentrated around one brand, or insufficient to recover fixed launch and compliance costs within an acceptable period.
How accurate is the SellerSprite Sales Estimator?
The result should be treated as a directional estimate rather than a confirmed sales figure. Reliability depends on category selection, BSR behavior, historical stability, seasonality, promotions, stockouts, variations, and the quality of the competitor set. Use demand ranges and cross-check the result with other market signals.
Does the Profitability Calculator show monthly profit?
The calculator provides per-unit profitability results and includes a Units Sold input that can be used to scale revenue and profit. Monthly totals are only as reliable as the sales-volume assumption entered.
Can I use the Profitability Calculator to estimate a competitor's margin?
You can build a hypothetical competitor cost scenario using visible price, dimensions, weight, category, and plausible sourcing assumptions. The result is not the competitor's confirmed margin because its actual COGS, freight, PPC, returns, and operating agreements are unknown.
Next Steps
- Choose one product idea and identify several genuinely comparable ASINs.
- Use the SellerSprite Sales Estimator to create downside, expected, and upside demand ranges.
- Collect realistic price, packaging, product cost, freight, PPC, return, and storage assumptions.
- Enter them into the SellerSprite Profitability Calculator.
- Combine estimated monthly units with estimated net profit per unit and test whether the downside case meets your own sourcing criteria.
References
- SellerSprite Amazon Sales Estimation Guide View
- SellerSprite Profitability Calculator Guide View
- Amazon Sales Rank FAQ View
- Amazon Selling on Amazon Fee Schedule View
- Amazon FBA Fulfillment Fees View
- Amazon Revenue Calculator View
- SellerSprite Amazon Calculator Guide View
- SellerSprite Amazon Profit Margin Guide View
By SellerSprite Success Team
The SellerSprite Success Team combines Amazon marketplace experience with data-analysis expertise to help sellers evaluate product demand, operating costs, inventory risk, and profitability using practical workflows and marketplace data.
Last updated: 2026-07-30