TL;DR: Amazon Opportunity Explorer is a built-in Amazon Seller Central tool that gives you demand, competition, and estimated sales data for product niches. This step-by-step guide shows you how to use it for niche analytics, category analysis, and smarter product selection in the US market.
Key Takeaways
- Amazon Opportunity Explorer turns raw marketplace data into a clear opportunity score, helping you spot demand-and-competition gaps.
- Niche analytics is not just about search volume—you also need projected sales, clicked products, and category trends to pick a niche you can realistically win.
- Use Opportunity Explorer alongside category analysis and hands-on listing research before you commit to inventory.
Table of Contents
- What Is Amazon Opportunity Explorer?
- Why Niche Analytics Matters for Amazon Sellers
- How to Use Opportunity Explorer for Niche Analytics (Step-by-Step)
- Key Metrics to Evaluate in Niche Analytics
- Using Category Analysis to Spot Market Gaps
- Product Selection Applications: Turning Opportunities into Winners
- Practical Niche Scoring Model
- Common Mistakes to Avoid in Niche Research
- FAQ
- Next Steps
- References
Note on marketplaces: This guide is specifically optimized for the US market. Amazon Opportunity Explorer is available in Seller Central for US sellers with a Professional selling plan; features and metrics may differ in other marketplaces.
What Is Amazon Opportunity Explorer?
Amazon Opportunity Explorer (also called Product Opportunity Explorer) is a data-rich research tool built into Amazon Seller Central. It aggregates anonymous customer searches, clicks, and purchase behavior to show you what shoppers are looking for and where demand is not being satisfied. Instead of giving you raw keywords alone, it groups related terms into what Amazon calls "niches," then scores each niche based on a mix of demand, competition, and sales potential.
For US sellers, this tool is a game-changer because it removes a lot of guesswork from product research. You can see an estimated monthly search volume for a niche, the number of products customers click on, and even projected niche sales. That data lets you answer one crucial question before you order inventory: Is there a real gap I can profitably fill?
Opportunity Explorer was first introduced as a beta feature for Brand Registered sellers, then rolled out to more Professional sellers. Today it is a mainstream research tool for US-based businesses. Its real value lies in its ability to show niche-level data, not just keyword volume. For example, you can see that "silicone baking mat with measurements" generates 15,000 searches a month, but shoppers click only 4 different products. That insight alone can guide your product design, pricing, and listing strategy.
If you are new to Amazon analytics, start with our broader Amazon Seller Analytics Guide. It covers other essential metrics and tools that will help you build a complete analytics workflow.
On this page, we will focus specifically on how to use Opportunity Explorer for niche analytics, category analysis, and product selection decisions that win in the US market.
Why Niche Analytics Matters for Amazon Sellers
Selling on Amazon is not just about having a product; it is about having a product that customers are actively searching for and that you can competitively price. The difference between a profitable launch and a costly failure often comes down to one decision: the niche you pick.
A "niche" in Amazon terms is a cluster of related product searches, such as "dash cam for trucks" or "silicone baking mat with measurements." Niche analytics gives you three critical inputs:
- Demand: How many customers are searching for products in this niche each month?
- Competition: How many products are getting clicks, and how concentrated are sales among top listings?
- Opportunity: The interaction between demand, competition, and conversion trends—this is Amazon's "opportunity score" or "niche score."
Without this data, sellers often choose niches that are too broad (like "water bottles"), where giant brands dominate, or too narrow, where demand is too low to cover PPC costs. Niche analytics helps you find the middle zone: a product that enough people want, but that current listings serve poorly.
Additionally, niche analytics helps you understand seasonality. Some niches spike in Q4 or during summer. By looking at 12-month search trends in Opportunity Explorer, you can time your inventory and advertising to capture the demand curve. For example, a niche like "pool floats" will show a clear peak from May to August. If you enter in June, you may only capture the tail of the season. Better to launch in early spring with a low-cost listing, then scale PPC as demand climbs.
How to Use Opportunity Explorer for Niche Analytics (Step-by-Step)
Let's walk through the exact workflow for using Amazon Opportunity Explorer to find and validate a profitable niche. The steps below are based on the current US Seller Central interface.
Step 1: Access Opportunity Explorer
Log in to Amazon Seller Central and go to the Growth tab, then select Opportunity Explorer. If you do not see it, make sure you have a Professional selling plan and your account is enrolled in a marketplace that supports the tool (US is supported). If you are not Brand Registered, you may see a limited version; consider applying for Brand Registry to unlock the full feature set.
Step 2: Define Your Search Theme
Start with a broad seed term related to your business. For example, if you sell kitchen gadgets, enter "kitchen gadget" or "baking tool." You can also browse by category from the dashboard. The tool will generate a list of niches, each with its own set of search terms. Think of a seed term as a "category hypothesis." If you're not sure which direction to explore, use the "Search Volume" filter on the category page to find emerging niches.
Step 3: Review the Niche List
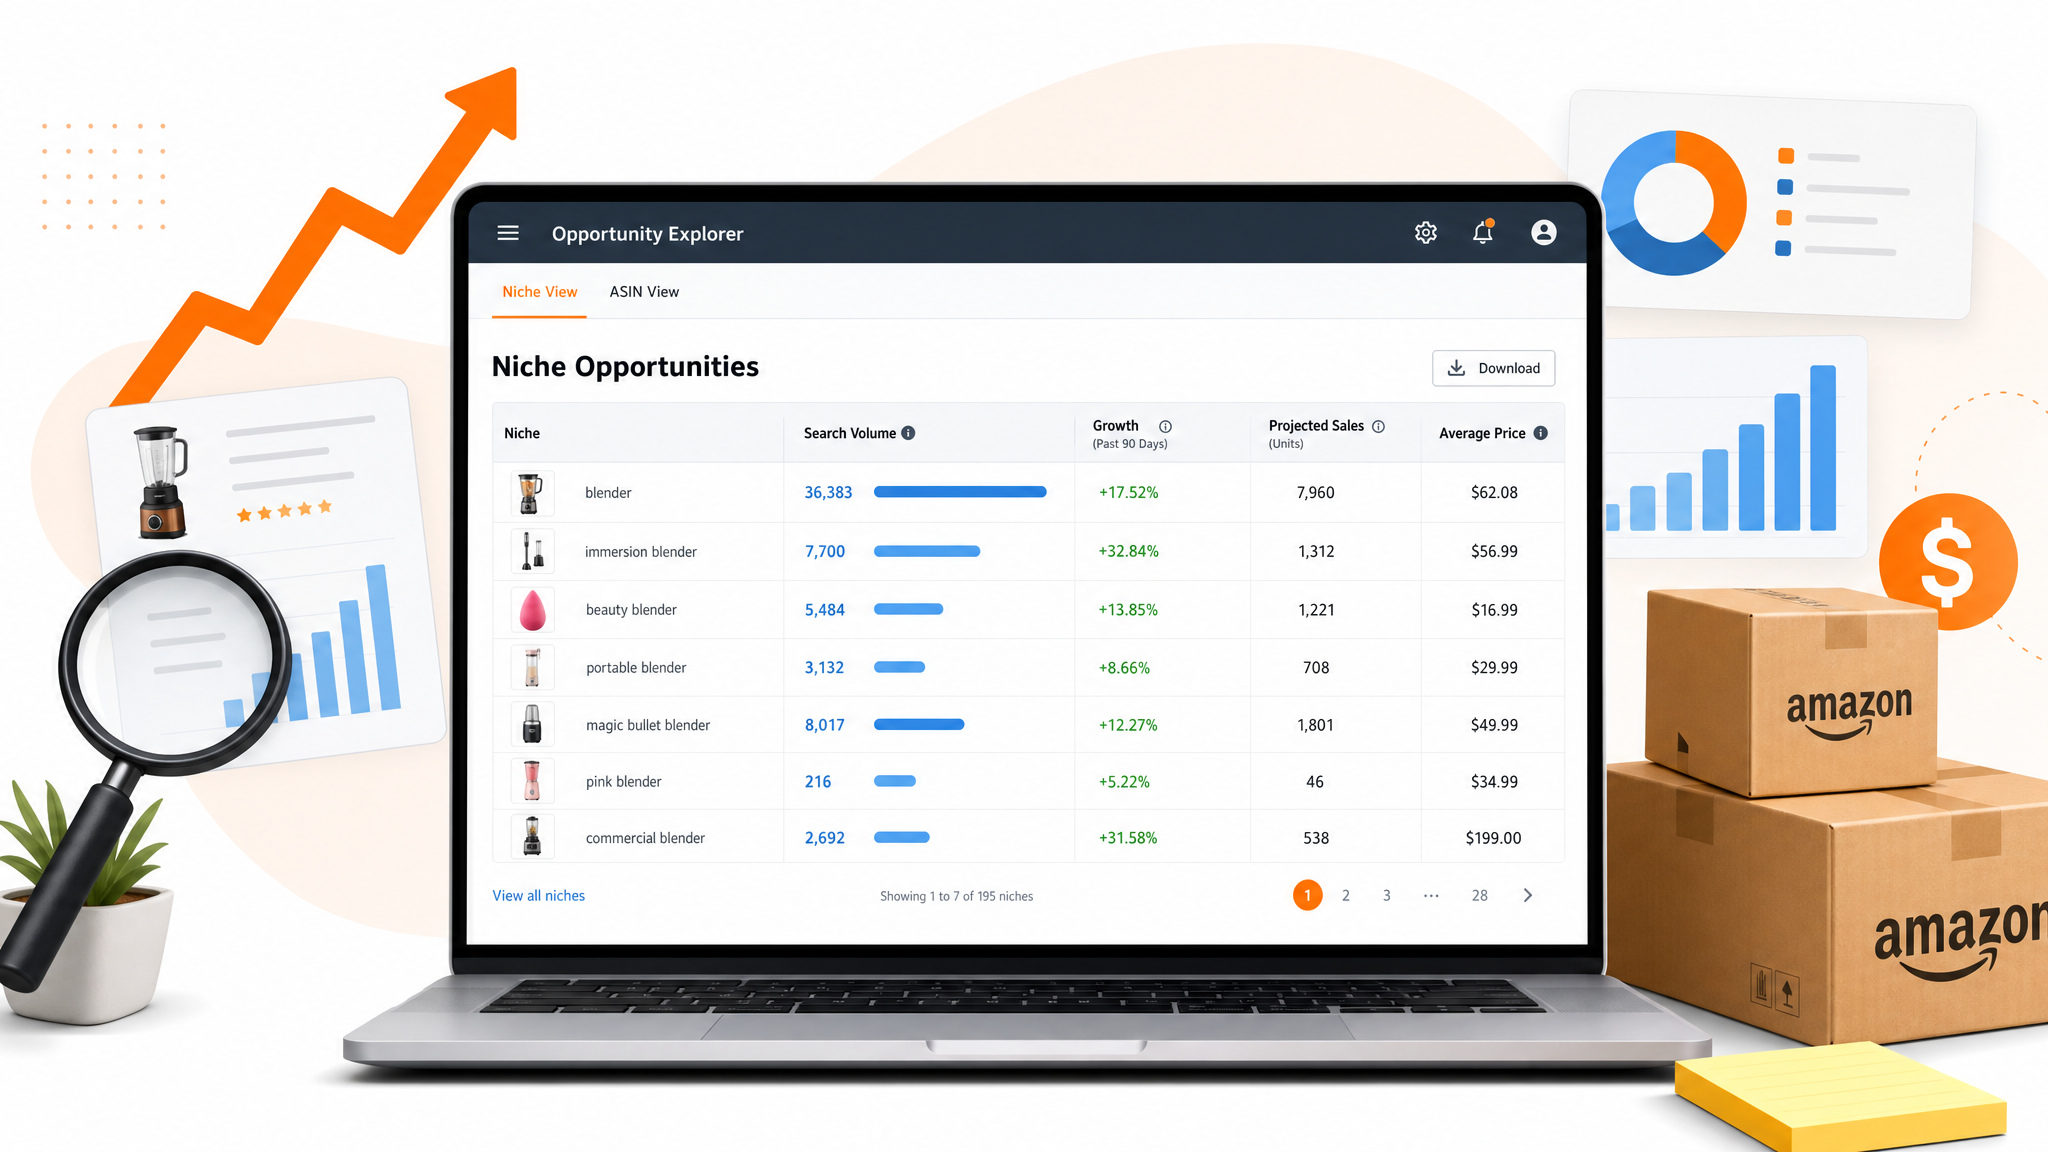
You'll see a table with columns like Niche, Niche Score, Search Volume, Number of Clicked Products, and Projected Niche Sales. In many versions you can also see "Customer Conversion Rate" or "Price Range." Sort by different columns to find niches with the best opportunity-to-competition ratio. For example, sort by "Projected Sales" to see the biggest revenue pools, then check "Number of Clicked Products" to spot where customer choice is limited.
Step 4: Drill Into a Promising Niche
Click on a niche to open a detailed view. Here you'll find charts showing search volume and sales over the past 12 months, top search terms, and a list of current top products. This is where you can qualify the niche: Are sales steady or seasonal? Are the top products recent? Is there room for a differentiated offer? The detailed view also shows the "Top Search Terms" within the niche—those are the exact keywords you should use in your listing title and bullet points.
Step 5: Compare Niches and Validate Externally
Create a shortlist of 5–10 niches. For each one, note the unit economics: average price, estimated monthly sales, and competition level. Then go to Amazon's search results and manually check the top listings. Look at review counts, ratings, and product photos. If the top products have low review counts or outdated photos, you may have found a gap.
To deepen this validation, use a tool like SellerSprite. With SellerSprite, you can reverse-ASIN top products to see their exact sales estimates, keyword rankings, and review velocity. This extra layer removes the guesswork from the opportunity score. For a complete walkthrough, see our Product Opportunity Explorer Guide.
Step 6: Export and Track Niches Over Time
Opportunity Explorer allows you to export the niche list to a CSV file. This is great for tracking changes over time. Save a monthly export and build a tracker in Google Sheets. Look at how search volume and niche scores change—this helps you spot rising opportunities before they become crowded. For example, you might notice "solar phone charger" has grown 40% month-over-month while "portable charger" has been flat. That is a signal to focus your product development budget.
Key Metrics to Evaluate in Niche Analytics
Understanding what the numbers mean is more important than just collecting them. Here are the core metrics you will see inside Amazon Opportunity Explorer and how to interpret them.
Niche Score
Amazon's niche score is a composite indicator that combines search demand, expected sales, and customer conversion potential. A higher score suggests a healthier opportunity. But it is relative—compare scores within the same category. A score of 800 in Home & Kitchen may be more meaningful than 900 in Pet Supplies, because the baseline competition differs.
Search Volume
This is the monthly number of search queries for the niche. High volume means strong demand, but also usually means more seller interest. Combine it with other metrics to assess your real chances. A niche with 20,000 searches and 5 clicked products is different from one with 20,000 searches and 30 clicked products—the former is often a supply gap.
Number of Clicked Products
This shows how many distinct products customers click after searching. A low number may indicate dissatisfied shoppers or a limited selection. If customers click only 3-4 products but dozens are listed, the niche may be underserved. It could also mean the search results are dominated by a few strong listings, so evaluate review counts.
Projected Niche Sales
Amazon estimates how much revenue this niche generates each month. This is critical for evaluating whether the niche is big enough to support your business goals—and if it can absorb a new entrant. For example, if you want to reach $50,000/month in revenue and the niche is only $30,000/month, you'll need to dominate the niche. If the niche is $300,000/month, a 10% share gives you $30,000.
Top Search Terms
These are the actual queries that make up the niche. They reveal customer intent and help you craft listing copy, PPC campaigns, and product features. For instance, if the top search terms include "for small bathroom," you know the niche is geared toward compact spaces, so your product should highlight those dimensions.
Price Range and Conversion
Some views show the price band and conversion rate. If prices are too low or conversion is weak, the niche may require a strong brand to win. Use this to calculate if you can cover your costs. For a standard product, your total cost (production + shipping + Amazon fees + PPC) should not exceed 40-50% of the selling price if you want a 20%+ profit margin.
These metrics work together. A niche with high search volume and low clicked products but strong projected sales may indicate a "demand gap"—shoppers are searching, but existing listings aren't capturing clicks. That is the classic white-space opportunity.
Using Category Analysis to Spot Market Gaps
Beyond individual niches, Opportunity Explorer lets you analyze entire categories. Category analysis is the macro view: you compare niches within a department to see where demand is growing, which subcategories are saturated, and where seasonal spikes occur.
For example, in Home & Kitchen, you might see "glass food storage containers" growing faster than "plastic containers." You can also identify niche searches that are rising quickly—Amazon labels some of these as "rising" or "new." These are early-stage opportunities where competition is still low. However, be cautious: some "rising" niches are fads and may crash quickly.
To run a category analysis:
- Use the category filter to select your target department.
- Sort by "Search Volume" or "Sales Growth" to find high-momentum niches.
- Check the 12-month trend chart for each niche. A steady upward trend is safer than a seasonal spike.
- Compare the number of clicked products vs. projected sales. A large gap means customers may not be finding what they want.
This macro view helps you avoid "zombie" niches—categories with lots of searches but poor conversion due to supplier issues or low perceived value. By looking at the trend curve, you can also time your launch. A category that's up 30% year-over-year is easier to grow into than one that's flat or declining.
Product Selection Applications: Turning Opportunities into Winners
The ultimate goal of niche analytics is product selection—choosing a specific product to sell. Here is how to translate Opportunity Explorer data into an actual product decision.
1. Build a candidate tier. From your niche shortlist, select niches with a niche score above the median in their category and a projected sales figure that meets your revenue target. For example, if you need $20,000/month in revenue and the average price is $25, you need at least 800 sales per month—or 10% share of a niche with 8,000 monthly sales. If the niche is smaller than your target, it's still viable for a side income, but not for a full-time business.
2. Check the supply gap. Look at the "Number of Clicked Products" metric. If only 5 products are clicked monthly, but the niche has 2,000 searches, existing listings may be failing to convert. This is a signal to enter with a better listing, better images, or a slightly differentiated product. For example, if all top products in a niche are black and clunky, offer a white, slim version with better packaging.
3. Review customer review counts. Use SellerSprite or Amazon search to check the top 10 listings in your niche. If most have under 500 reviews, the barrier to entry is lower. If they have 10,000 reviews, you'll need a large launch budget and a very strong differentiator. A good rule of thumb: if the average top-5 review count is below 1,000, you can compete with a good product and aggressive marketing.
4. Create a product brief. For each final candidate, write a one-page brief containing: target price, key features, target keywords, and a rough production cost. Don't forget to include PPC costs. Use the top search terms from Opportunity Explorer as the core keyword set for your listing.
5. Run a "minimal viable" test. Before ordering thousands of units, consider a small test order or use Amazon's "Brand Referral Bonus" to get early traffic. You can also use PPC campaigns with a single product to validate interest. Set a budget threshold: if you spend $200 and get no meaningful clicks, the niche may not be as attractive as the data suggested.
This process turns a high-level opportunity score into a concrete, de-risked inventory decision. It combines Amazon's data with the granular sales intelligence from SellerSprite—a one-two punch that successful sellers use.
Mini Case Study: How a New Seller Used Niche Analytics
Background: A new seller in the US wanted to launch a home organization product but didn't know which niche to choose. They used Opportunity Explorer to search "drawer organizer." They found the niche "drawer organizer for kitchen utensils" had 14,000 searches, 9 clicked products, and projected sales of $90,000/month. The top product had 800 reviews.
Next, they used SellerSprite to reverse-ASIN the top 3 products. They discovered that one product was an "Amazon's Choice" but had a rating of 4.0 with many complaints about "fit and finish." Another had 2,000 reviews but was missing a "deep" option for larger drawers. The seller launched a version with adjustable dividers and targeted the keyword "adjustable deep drawer organizer." They used a low-cost PPC campaign in the first month to validate conversion. After 60 days, they achieved 150 reviews and a 12% conversion rate, which was above the category average.
This case shows how to combine Opportunity Explorer with product-level data. The tool pointed to the niche; SellerSprite and manual review confirmed the specific positioning.
Practical Niche Scoring Model
To avoid relying on a single metric, create your own weighted niche scorecard. Here's a simple model you can adapt for any product category. Score each niche from 1 to 5 for five factors, then multiply by a weight:
- Demand (weight 30%): Based on search volume. Give 5 points for 10,000+ searches/month, 4 for 5,000-10,000, 3 for 2,000-5,000, 2 for 1,000-2,000, 1 for under 1,000.
- Competition (weight 25%): Based on the "Number of Clicked Products." Fewer clicked products with high search volume means lower competition. Give 5 points if fewer than 5 clicked products, 4 for 5-8, 3 for 9-15, 2 for 16-25, 1 for 25+.
- Sales Potential (weight 20%): Based on projected niche sales. Give 5 points for $500k+/mo, 4 for $200k-$500k, 3 for $100k-$200k, 2 for $50k-$100k, 1 for under $50k.
- Review Barrier (weight 15%): Check the average review count of the top 5 products. Give 5 points for average under 500 reviews, 4 for 500-1,000, 3 for 1,000-2,000, 2 for 2,000-5,000, 1 for 5,000+.
- Seasonality (weight 10%): Give 5 points for steadily growing niches (12-month uptrend), 4 for stable demand, 3 for mild seasonality, 2 for one big seasonal peak, 1 for declining demand.
Multiply each score by its weight, sum the results, and you get a total out of 5.0. Aim for a score above 3.5. This model forces you to think about a niche holistically rather than chasing one number. It also helps you communicate your decision to partners or investors.
Common Mistakes to Avoid in Niche Research
Even with powerful tools, sellers make repeatable mistakes. Here are five traps to avoid.
Mistake 1: Choosing a Niche Solely on Search Volume
High search volume often means high competition. A niche with 50,000 searches but 30 established bestsellers can be harder to crack than a niche with 8,000 searches and only two strong players. Always weight the score and clicked products.
Mistake 2: Ignoring Seasonality
Many niches are seasonal. If you launch in October for a product that peaks in December, you'll miss the window. Check the 12-month chart before ordering. Also consider your cash flow: if you need to buy inventory months before the season, you'll need enough capital to wait.
Mistake 3: Not Checking the Actual Search Results
Amazon's data shows the niche, but not the quality of existing listings. Always click through to Amazon and see what you're up against. If the top listings have thousands of reviews and a premium brand, the "gap" may be painful to exploit. Look at the listing images and bullet points too—if every listing says the same thing, you can differentiate on content.
Mistake 4: Overestimating the Niche Score
The niche score is a relative indicator, not a promise. Amazon updates it periodically, and scores can shift with marketplace changes. Use it as one data point, not the final answer. Always validate with external sales estimators.
Mistake 5: Skipping Unit Economics
Even in a great niche, if the average selling price is $12 and your production cost is $8, your margin may not support PPC or returns. Use the price range filter and calculate your landed cost before committing. A good niche on paper can fail if the margins don't work.
FAQ
How can Amazon Opportunity Explorer help me find profitable product niches?
Opportunity Explorer groups related customer searches into niches and scores them by demand, competition, and projected sales. Instead of guessing, you can see which niches have high search volume, low clicked-product counts, and healthy projected revenue. By filtering and comparing these metrics, you can spot underserved segments—for example, a niche where customers click only a few existing products, indicating low satisfaction or limited selection. That's a classic "unmet demand" opportunity. Pair the data with a quick review of top listings to confirm the gap is real before you invest in inventory.
What metrics does Amazon Opportunity Explorer provide for niche analytics?
The tool provides a set of demand and supply metrics, including: search volume (monthly number of customer queries), number of clicked products (how many items customers click on), projected niche sales (estimated monthly revenue for the niche), niche score (a composite opportunity indicator), top search terms, price range, and a 12-month sales/search trend chart. Some versions also show conversion rate or customer satisfaction indicators. For deeper sales data, you can export the niche list and use an analytics tool like SellerSprite to get exact sales estimates for the top products.
Is Amazon Opportunity Explorer available for US sellers?
Yes. Amazon Opportunity Explorer is available to US sellers with a Professional selling plan. It appears under the Growth tab in Seller Central. The data is specific to the US marketplace, which makes it valuable for planning products, PPC campaigns, and inventory. If you don't see it, check that your account is in good standing and that you have the Professional plan. Some features may be rolled out gradually, so keep an eye on the dashboard.
Next Steps
- Open Amazon Seller Central and run your first Opportunity Explorer search today. Start with a broad seed term and build a shortlist of 5 niches using the metrics above.
- Create a free SellerSprite account to turn those niches into validated product opportunities. Use reverse ASIN and keyword tools to confirm demand before you order inventory. Sign up here.
References
- Amazon Advertising: Opportunity Explorer View
- Amazon Seller Central Help: Product Opportunity Explorer View
- SellerSprite: Amazon Seller Analytics Guide View
By SellerSprite Content Expert
Amazon seller tools and marketplace SEO specialist.
Editorial process: AI-assisted draft prepared for human fact-checking, source verification, and brand review before publication.